


How to Evaluate School Options: A Parent's Guide

Choosing the right school for your child comes down to six steps: define your priorities, understand school types, gather objective data, visit and ask targeted questions, score schools on a 15-factor weighted worksheet, and confirm logistics before you commit. That process, done well, takes the guesswork out of one of the most meaningful decisions a family makes.
Here is the six-step checklist you can start using today:
Step 1: Define priorities. List 15 criteria across academic, social-emotional, and practical domains, then assign each a weight.
Step 2: Map your options. Identify every realistic school type available to your family within a feasible distance or enrollment window.
Step 3: Gather data. Pull state report cards, NCES enrollment and staffing data, and district reports before you visit anything.
Step 4: Visit and observe. Schedule tours during regular school hours, observe classrooms, and ask stakeholder-specific questions.
Step 5: Score each school. Use the 15-factor worksheet to rate every school on a 1–5 scale across all criteria.
Step 6: Confirm logistics and decide. Run a final feasibility check on commute, cost, and deadlines, then make the call with your child.
Pro Tip: Weight the worksheet by your child’s specific needs first. A child with an IEP needs special education services weighted highly; a college-track student may weight academic rigor and AP access equally highly. The weights change the outcome more than the scores do.
Table of Contents
How do you define what matters most for your child and family?
Before you compare a single school, you need a clear picture of what you are actually looking for. Without that, every school visit turns into a general impression rather than a structured assessment.
Start by listing 15 priorities across three domains. Academic priorities might include curriculum rigor, college-prep programs, language instruction, or STEM focus. Social-emotional priorities could cover class size, counseling availability, anti-bullying policies, or the school’s approach to student wellbeing. Practical priorities include commute time, before/after-care hours, tuition affordability, and application timeline.
Once you have your list, assign each priority a weight. A simple 1–5 scale works well: 5 means non-negotiable, 1 means nice to have. Alternatively, distribute 100 percentage points across your list so the weights sum to 100. Either method forces you to rank what genuinely matters versus what just sounds appealing in a brochure.
The priorities shift significantly by child and stage. Consider these contrasts:
A five-year-old starting kindergarten: weight nurturing environment (5), small class size (5), play-based learning (4), proximity to home (4), and extended care availability (3).
A ninth-grader on a college track: weight AP/IB course access (5), graduation rate (5), college counseling quality (4), extracurricular depth (3), and campus safety (3).
A child with a learning difference: weight special education services (5), IEP support quality (5), student-teacher ratio (4), counseling access (4), and inclusive culture (4).
Write your weighted list down before you research a single school. That document becomes the rubric your worksheet is built on, and it keeps you from being swayed by a beautiful campus or a persuasive admissions tour. As ParentData’s step-by-step guide puts it, the goal is to compare realistic options against family-specific criteria, not to search for a universally “best” school.
Where do you find reliable school data, and how do you read it?
Objective data should inform your worksheet scores before a visit ever happens. The three primary sources for U.S. families are state report cards, NCES, and district-level data portals.
State report cards are published annually by each state’s Department of Education and are required under the Every Student Succeeds Act (ESSA). They report proficiency rates in math and English language arts, graduation rates, chronic absenteeism, and, increasingly, school climate survey results. Find your state’s portal through the U.S. Department of Education’s parent-facing guidance.
NCES (National Center for Education Statistics) provides federal-level data on enrollment, demographics, staffing ratios, and program offerings. Use NCES state program data to pull baseline metrics for any school in the country, including student-teacher ratios and Title I status.
The proficiency vs. growth distinction is the most important data concept to understand. Proficiency scores tell you what percentage of students met a grade-level standard on a single test. They are heavily influenced by family income and student demographics. Growth metrics, sometimes called value-added measures, track how much individual students improved over time, regardless of where they started. A school serving a high-poverty population may show low proficiency but strong growth, meaning the school is genuinely effective. FutureEd and Keystone’s Quality Check analysis makes the case that growth metrics, combined with climate surveys and course access, give a far more accurate picture of what a school actually contributes to student learning.
As Education Week’s analysis cautions, single-number school ratings often obscure more than they reveal. Always look at multiple years of data, not just the most recent snapshot.
Here is the data table to complete for each school before your visit:
Data Field | Where to Find It | What It Tells You |
Enrollment size | NCES / state report card | School scale; affects class size and resources |
Student demographics | NCES | Context for interpreting proficiency scores |
Proficiency rates (ELA, math) | State report card | Grade-level achievement benchmarks |
Growth/value-added score | State report card (where available) | How much the school accelerates learning |
Student-teacher ratio | NCES / school website | Indicator of individual attention available |
Chronic absenteeism rate | State report card | Proxy for school climate and student engagement |
Special education services | District website / school directly | IEP and accommodation capacity |
Extracurricular offerings | School website | Enrichment depth beyond academics |
Teacher retention rate | Ask directly during visit | Leadership and culture stability |
Pro Tip: Pull data from at least three consecutive years. A single strong year can reflect a testing anomaly; a consistent upward trend in growth scores is the signal worth trusting.
What should you look for during a school visit?
A school visit scheduled during regular hours, not a staged open house, is where data becomes real. Classroom observations and unscripted conversations with staff and students reveal things no report card captures. Scientific American’s synthesis of school effectiveness research consistently points to teacher quality, positive climate, and community connection as the factors that shape a child’s daily experience most directly.

Questions to ask each stakeholder
Principal or head of school:
How do you measure whether students are growing, not just meeting grade-level standards?
What is your teacher retention rate over the past three years?
How does the school handle a child who is struggling academically or socially?
What does parent communication look like week to week?
Classroom teachers:
How do you differentiate instruction for students at different levels in the same class?
What does a typical day look like for a student in your class?
How do you involve parents in their child’s learning?
School counselor:
What social-emotional learning programs does the school use?
How does a student get referred for additional support, and how quickly does that happen?
Current parents (seek them out independently, not through the school’s referral list):
What surprised you most after your child started here?
What do you wish you had known before enrolling?
How does the school handle conflict between students?
Students (if age-appropriate):
What is your favorite part of the school day?
Do you feel like teachers know you personally?
Observation checklist for the classroom and campus
Are students actively engaged, or passively waiting?
Is student work displayed, and does it reflect genuine effort and variety?
Do teachers address students by name and respond to questions warmly?
Are hallways and common areas calm and orderly without feeling rigid?
Is the physical environment clean, well-maintained, and resourced with current materials?
Does the library or media center appear actively used?
Are technology resources (devices, software, connectivity) visible and functional?
Do students with visible support needs appear included in classroom activity?
For unbiased feedback from families, search parent forums and neighborhood Facebook groups independently. The school’s own parent ambassador program will always present a favorable picture. You want the honest account from a parent whose child had a difficult year, not just the success stories.
Pro Tip: Ask to evaluate teaching quality by observing a lesson in progress, not just a classroom tour. Five minutes of watching a teacher manage a discussion tells you more than any credential list.
How do you score and compare schools objectively?
The 15-factor weighted worksheet is the core tool for turning observations and data into a comparable score across multiple schools. The Public School Review’s comparison worksheet recommends rating each factor on a 1–5 scale, where 1 is poor and 5 is excellent, then multiplying each score by its weight to produce a weighted score. The school with the highest total weighted score across all 15 factors is your strongest match on paper.
The OECD’s school evaluation framework supports this multimetric approach, noting that effective school assessment combines instructional practices, outcomes, and broader compliance and climate indicators rather than relying on any single dimension.
The 15 evaluation factors
Academic performance (proficiency and growth data)
Teacher quality (credentials, retention, instructional style)
Leadership quality (principal stability, vision, responsiveness)
School climate and culture (safety, belonging, discipline approach)
Student support services (counseling, tutoring, intervention programs)
Safety and discipline policies
Extracurricular and enrichment programs
Class size and student-teacher ratio
Technology and facilities
College and career readiness (AP/IB access, counseling, graduation rates)
Inclusion and diversity practices
Transportation and location logistics
Parent communication and involvement
Special education services and accommodations
Overall program fit (curriculum alignment with your child’s learning style)
How to build and use the worksheet
Assign each factor a weight from 1–5 based on your priority list from Step 1. Cap any single factor at a weight of 5 to prevent one criterion from dominating the entire result. Then score each school on each factor from 1–5 based on your data and visit observations. Multiply score by weight to get the weighted score for each cell, then sum the column.
Here is a sample scored row to show the math:
Factor | Weight | School A Score | School A Weighted | School B Score | School B Weighted |
Teacher quality | 5 | 4 | — | 3 | 15 |
Class size | 4 | 5 | — | 3 | 12 |
Special ed services | 5 | 3 | 15 | 5 | — |
School climate | 4 | 4 | — | 4 | — |
Transportation | 2 | 5 | 10 | 2 | 4 |
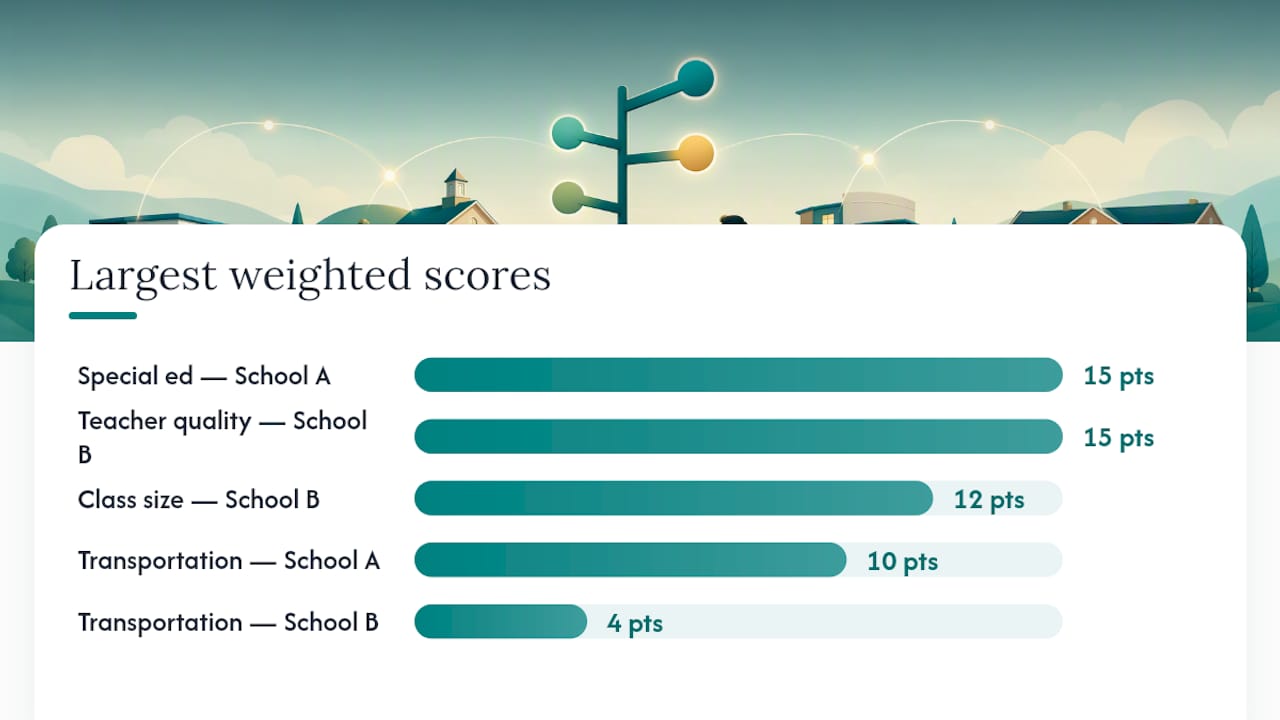
In this example, School A scores higher overall, but School B leads on special education services. If that factor carries a weight of 5 for your child, the gap on that single row may outweigh the total score difference. That is exactly the kind of nuance the worksheet surfaces. For a deeper look at how holistic comparison tools work in practice, the worksheet framework translates across school systems.
Save the worksheet and revisit it each year. Priorities shift as children grow, and a school that scored well at age six may need reassessment by age ten.
What logistics and timelines do families need to plan for?
Even the highest-scoring school on your worksheet becomes the wrong choice if the logistics are unworkable. Commute time, application deadlines, and hidden costs can each make or break a placement.
Admission timeline for U.S. families
Timing | Action |
12 months before enrollment | Research school types, pull NCES and state report card data, build your priority list |
9–12 months before enrollment | Schedule school visits, attend open houses, begin the worksheet |
6–9 months before enrollment | Submit applications; apply to multiple schools to reduce placement risk |
3–6 months before enrollment | Complete testing, interviews, or recommendation letters where required |
1–3 months before enrollment | Confirm acceptance, review financial aid, arrange transportation and care |
— | Confirm logistics: commute route, before/after care enrollment, uniform or supply lists |
Application requirements to prepare
Academic transcripts or previous school records
Teacher or counselor recommendation letters (private and some charter schools)
Standardized test scores (selective private schools)
Student essays or interviews (selective programs)
Proof of residency (public and magnet schools)
Immunization records
Apply to at least three schools simultaneously. Waitlists are common at charter and magnet schools, and a single application strategy leaves families with no fallback if a first-choice placement falls through.
Hidden costs to factor into your worksheet
Transportation is the most commonly underestimated cost. A school without bus service may require daily rideshare or a parent commute that adds an hour to the family’s day. Before/after care fees at private schools can add significantly to annual tuition. Enrichment fees, uniforms, and technology fees are rarely listed prominently in admissions materials. Ask directly for a full-year cost estimate, including all optional programs, before you finalize your worksheet scores on the transportation and logistics factor.
School location affects more than commute time. It shapes attendance consistency, after-school activity access, and the social geography of your child’s friendships.
Key Takeaways
Evaluating school options well means combining objective data, structured observation, and a weighted worksheet to make a decision you can defend and revisit.
Point | Details |
Prioritize growth over proficiency | Growth metrics show what a school adds to learning; proficiency scores reflect demographics more than teaching quality. |
Use the 15-factor worksheet | Rate each school on 15 criteria using a 1–5 scale, weighted by your child’s specific needs, for an objective comparison. |
Visit during regular school hours | Classroom observations and candid conversations with current parents reveal more than any open house presentation. |
Plan logistics early | Apply to multiple schools 6–9 months ahead and account for transportation, care, and hidden fees in your total cost estimate. |
Edu as a model to consider | Edu’s small class sizes and inquiry-based learning reflect several high-weight worksheet factors, including teacher quality, class size, and program fit. |
Why a structured approach beats a gut feeling every time
There is a persistent belief among parents that the right school will simply “feel” right on a visit. That instinct is not worthless, but it is unreliable on its own. What feels warm and welcoming on a tour is often a reflection of the admissions team’s skill, not the school’s day-to-day culture. The classroom you observed for ten minutes may have been the school’s strongest teacher. The principal who greeted you warmly may be leaving at the end of the year.
The research is consistent on this point. Scientific American’s review of school effectiveness studies finds that teacher quality, climate, and community connection are the factors that most reliably predict a child’s experience, yet these are precisely the things a brief tour obscures. A structured worksheet forces you to gather evidence on each of these dimensions rather than letting a single strong impression carry the whole decision.
Test scores alone are an even weaker guide. As Education Week’s analysis of school quality measurement notes, single-number ratings routinely obscure context, and a school’s ranking can shift dramatically depending on which year’s data you look at. The OECD’s evaluation framework reinforces this: meaningful school assessment requires combining instructional quality, outcomes data, and climate indicators together.
The role of school leadership is one of the most underweighted factors in parent decision-making. A strong principal creates teacher retention, which creates classroom consistency, which creates the stable, nurturing environment every child deserves. Ask about leadership tenure before you ask about test scores.
The worksheet is not a replacement for judgment. It is a structure that makes your judgment more reliable. Use it, revisit it after enrollment, and trust the process enough to update it when your child’s needs change.
Useful sources and tools for your research
These are the authoritative resources referenced throughout this guide. Each one serves a specific purpose in the evaluation process.
The School Choice Comparison Worksheet: 15 Factors Beyond Test Scores
Four Steps to Selecting a School for Your Child | Reading Rockets
How to Choose a School for Your Child (Step-by-Step)
QUALITY CHECK: The New, Best Way to Measure School Performance (FutureEd/Keystone analysis)
Factors to consider in picking a school for your child (Scientific American)
School evaluation (OECD)
Do we know how to measure school quality? (Education Week opinion)
NCES state program data (NCES)
Choosing a School: A Parent’s Guide (U.S. Department of Education)
Edu puts several high-weight worksheet factors in one place
For families who have worked through this guide and want a school that already scores well on the factors that matter most, Edu offers a genuinely different kind of environment. Astor International School in Singapore is a small, award-winning school for children aged 5–12, recognized as both the best small school and the best affordable international school in Singapore. Small class sizes mean the student-teacher ratio factor on your worksheet scores at the top end, and the inquiry-based learning approach is designed to build curiosity and confidence in every child, not just the ones who already thrive in large, competitive settings.

The curriculum covers core academics alongside enrichment in arts, sports, and languages, so extracurricular depth and program fit are built in rather than bolted on. For families with younger children, the Astor International Preschool at Holland offers the same nurturing philosophy with two playgrounds and a blend of outdoor and classroom learning from age 1.5. If you are ready to see how a small, caring school measures up against your own weighted worksheet, explore admissions at Astor and request a visit during regular school hours, exactly as this guide recommends.
Recommended
When I think about picking a school, I focus on the basics. How good the teachers are matters. I also look at the courses, the area around the school, and the buildings and tools students use. Then there is the cost, and the overall vibe in the classroom. It helps to ask if it feels right for the child.
Parents should not only copy what other families do. They should also think about what their child needs day to day and what the child likes. If a company offers Australain book publishing services, it could help by providing learning materials.